Energy-Efficient Bipedal Locomotion
Independent 2D simulation, 3D PPO and gait-energy analysis, and simulation–hardware timing diagnosis.
Research case study · Robot learning & mechanics
I independently developed a 2D biped simulation environment, trained and evaluated 3D PPO locomotion policies for LIMX TRON 1A in Isaac Gym, and analyzed gait coordination, joint power, and cost of transport. I also diagnosed and corrected inconsistent simulation and execution time bases in MuJoCo–hardware comparisons.

- BuildIndependent 2D simulationRigid-body dynamics, contact, PD actuation, and PPO.
- Train3D locomotion policiesPPO training and evaluation with reward and control tuning.
- AnalyzeGait and joint mechanicsHuman references, torque, power, and transport cost.
- DiagnoseSimulation–hardware timingSingle-joint tests exposed inconsistent time bases.
01 / Build
Independent 2D Simulation
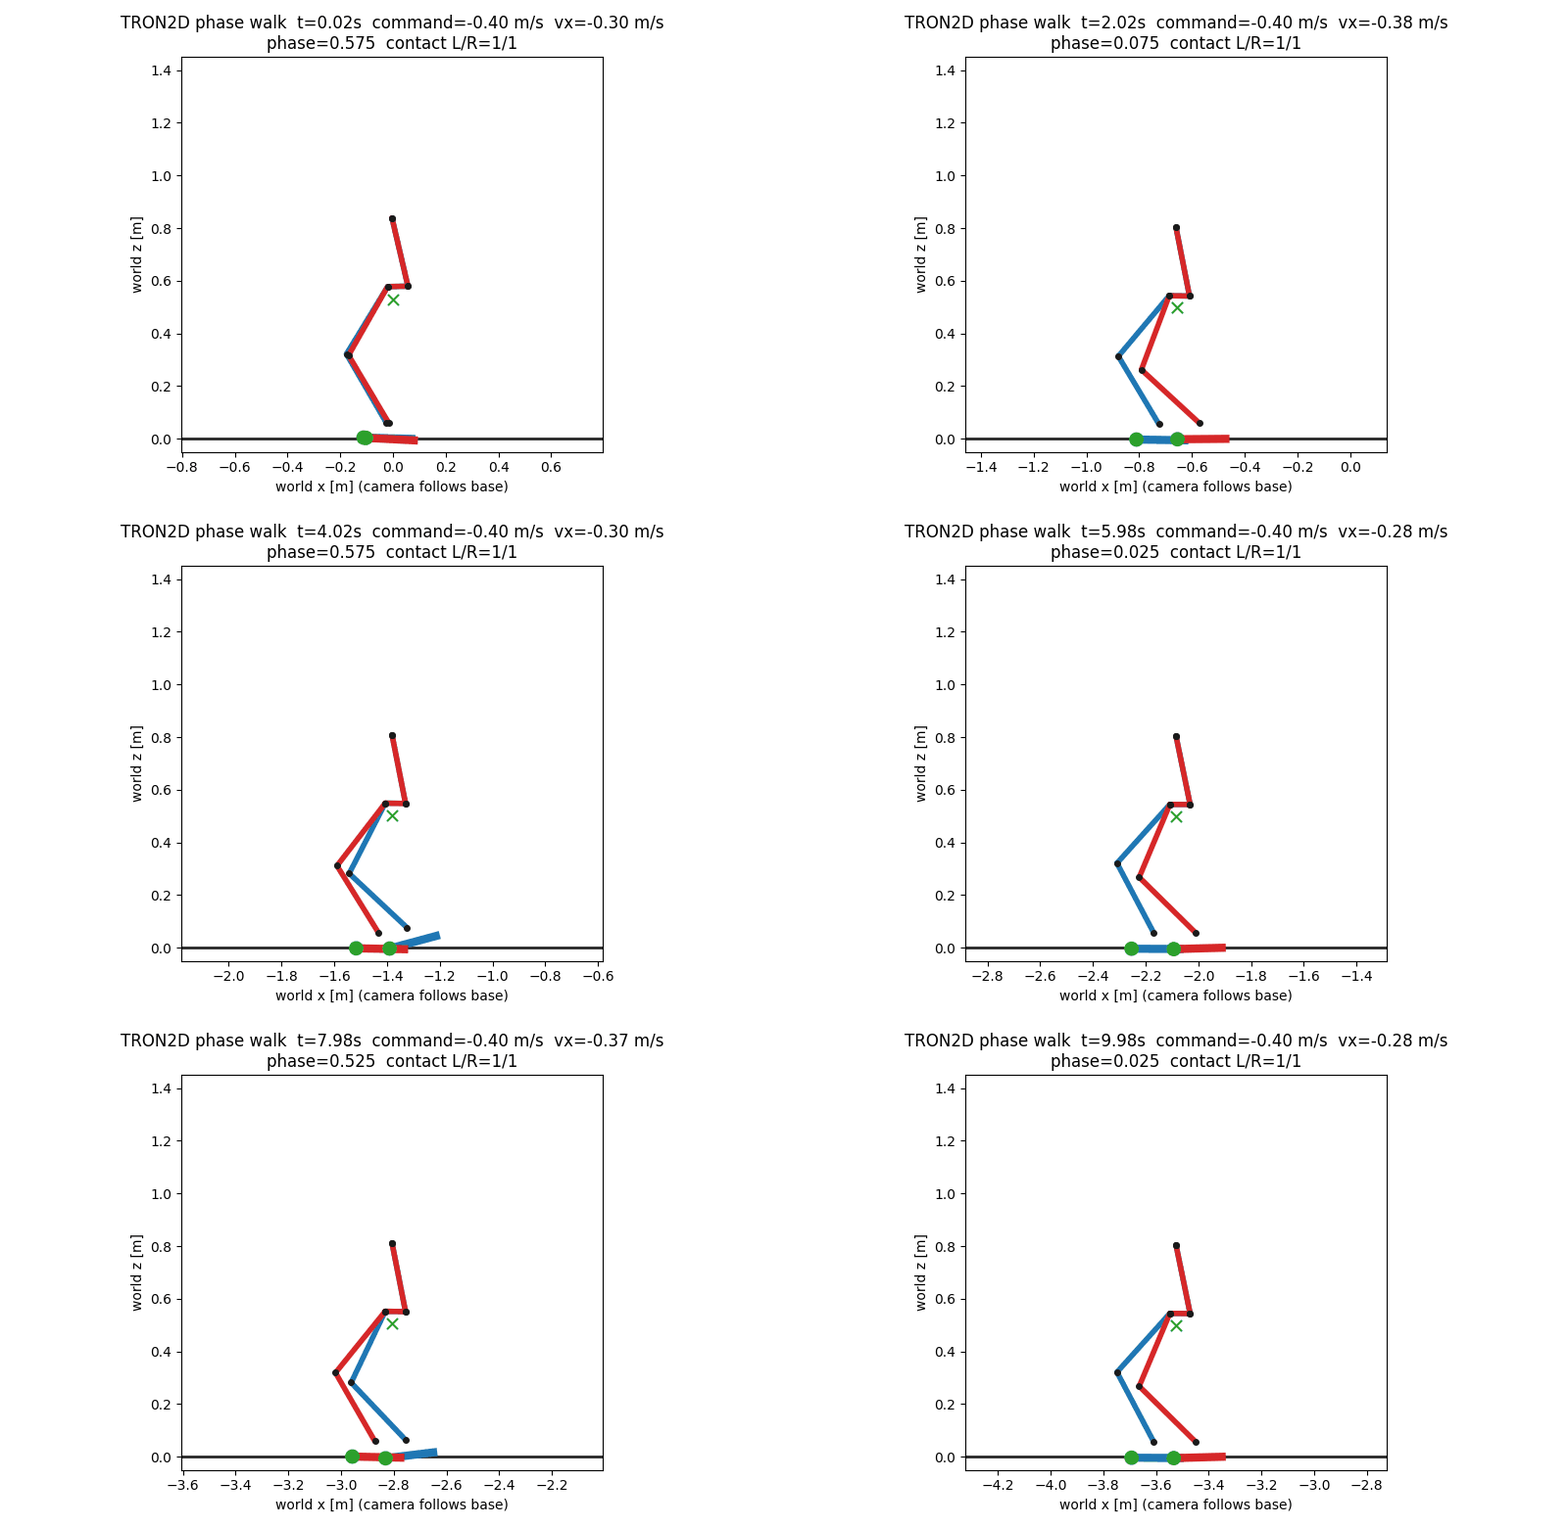
I independently developed a planar biped environment with rigid-body dynamics, foot–ground contact, and PD actuation, and implemented PPO training to study gait- and energy-related reward designs.
The reduced model made the control loop easier to inspect: a policy selected joint-position targets, the PD controller generated limited joint torques, and contact forces determined the response at the feet. This provided a setting for examining how reward choices affected joint behavior.
02 / Train
3D PPO Locomotion Training
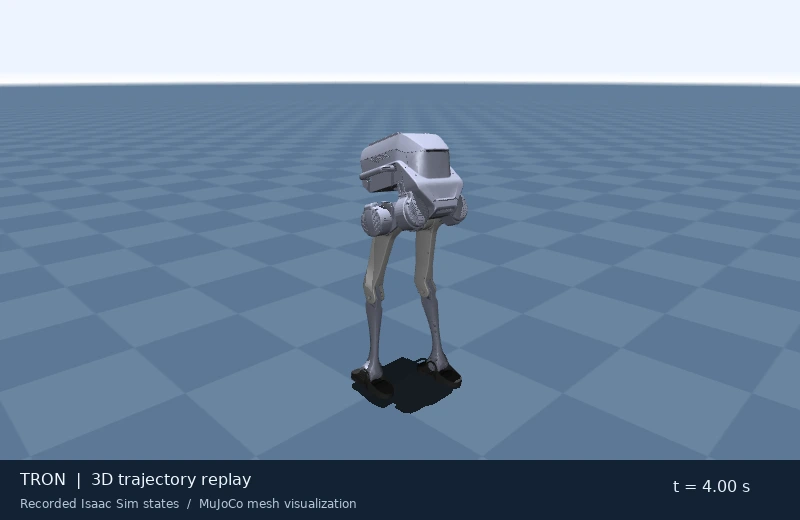
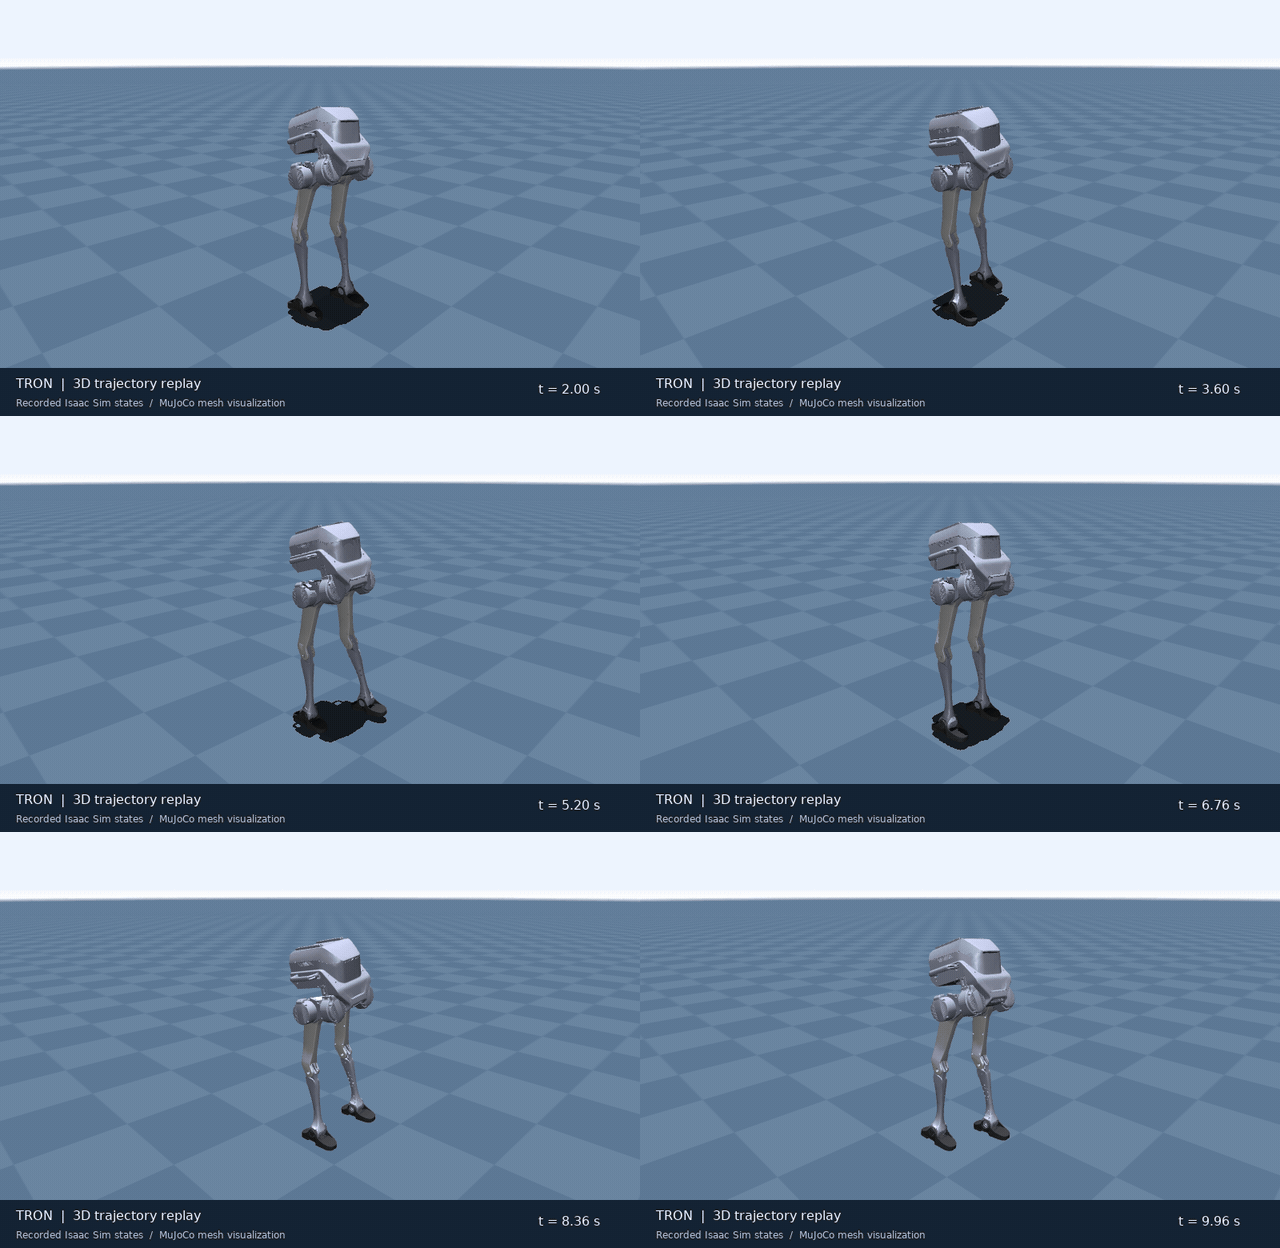
For the LIMX TRON 1A, I trained PPO policies using the lab’s Isaac Gym framework, tuning reward terms and control parameters. My contribution centered on policy training and analysis within that framework.
The control loop links observations of the robot and its commanded motion to joint-position targets. PD gains and torque limits determine how those targets become motion; gait- and energy-related rewards influence which behavior training favors.
03 / Analyze
Gait-Cycle Analysis
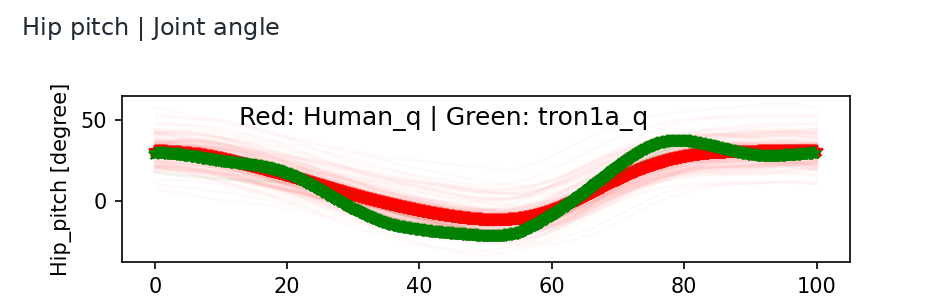
I collected and processed hip, knee, and ankle trajectories and developed gait-cycle visualizations against human walking references. Comparing the joints over a cycle made it possible to examine coordination and identify differences that a scalar reward could hide.
A cycle runs from one foot’s touchdown to its next touchdown, with toe-off separating stance and swing. Event alignment matters: a timing shift can otherwise look like a change in joint behavior.
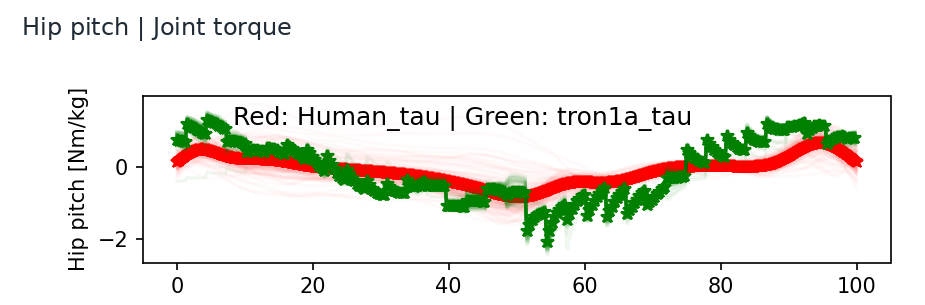
Hip pitch
Compare the timing and extent of hip motion alongside the associated joint moment.
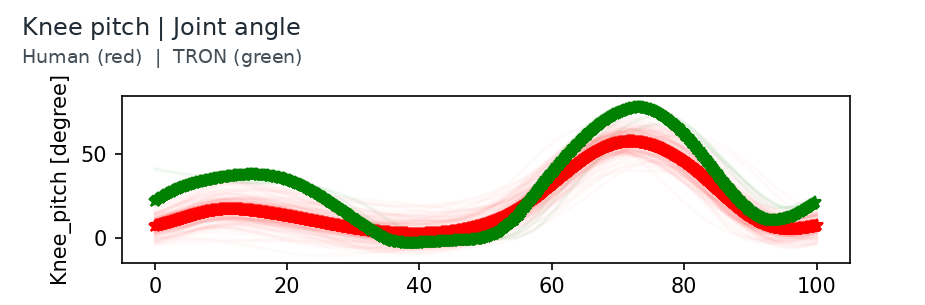
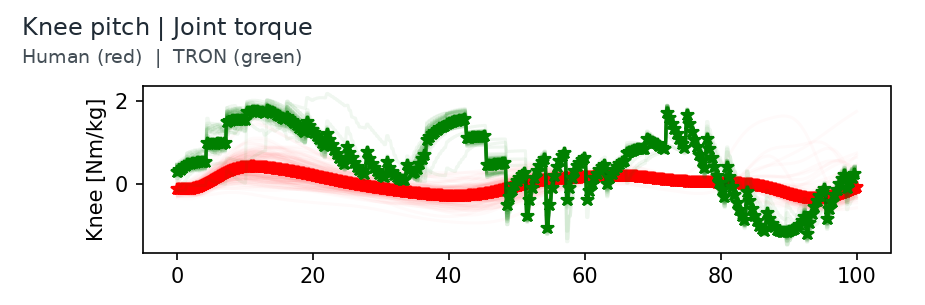
Knee pitch
Inspect stance flexion and the larger swing-phase excursion together with knee torque.
Ankle pitch
Compare ankle posture and moment through stance and the transition into swing.
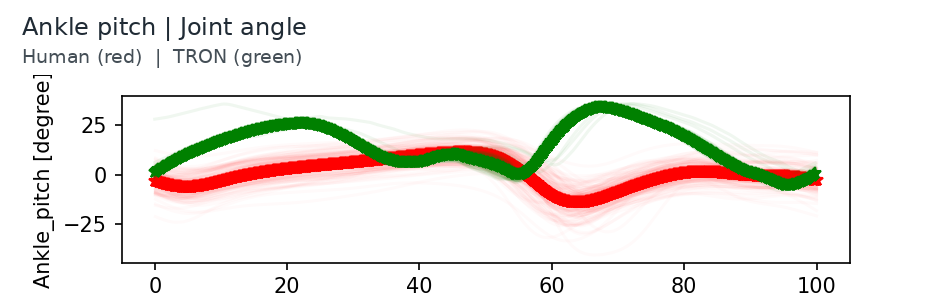
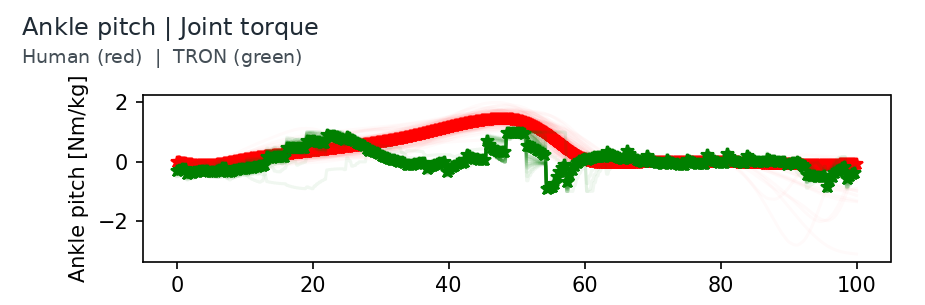
Source: Zuojun project notes, PDF p. 31, used as historical team analysis material. The curves, axis scales, and normalization are preserved. Their underlying samples and cycle count were not recovered for this page; the faint traces are not relabeled as a confidence or standard-deviation band. Touchdown/toe-off alignment was requested in the notes, but has not been independently re-established for these extracted plots. Select any plot to inspect it at full size.
04 / Interpret
Diagnosing Joint-Level Inefficiency
The historical gait discussion connected differences in joint motion to the effort required in each phase. I used this kind of joint-level analysis to look beyond whether the robot remained upright and followed a command.

Support knee
A flexed stance posture coincides with sustained knee effort in the plotted cycle. This motivates checking how support posture affects joint loading.
Swing knee
The larger flexion excursion motivates examining acceleration and deceleration effort. The notes also raise possible joint-limit interaction as a hypothesis.
Ankle / push-off
Ankle posture and push-off need to be considered alongside knee motion when interpreting propulsion and foot-clearance demands.
Mechanical energy: from a joint trace to work
Joint power combines torque with angular velocity. Integrating power over the same time interval connects a gait pattern to mechanical work; torque alone cannot establish energy consumption.
Joint powerPj(t) = τj(t) · q̇j(t)Torque in N·m and angular velocity in rad/s give power in W.
Mechanical workW+ = ∫ Σj max(Pj, 0) dtPositive work differs from absolute work ∫ Σ|Pj| dt and net work ∫ ΣPj dt.
Mechanical CoTCoT = W / (m · g · d)The chosen work definition, mass, traveled distance, and evaluation interval must accompany the value.
Mechanical CoT is not electrical or battery CoT. No numeric CoT result is reported here because a matching source record and calculation protocol have not been established.
05 / Compare
Cross-Simulator Evaluation
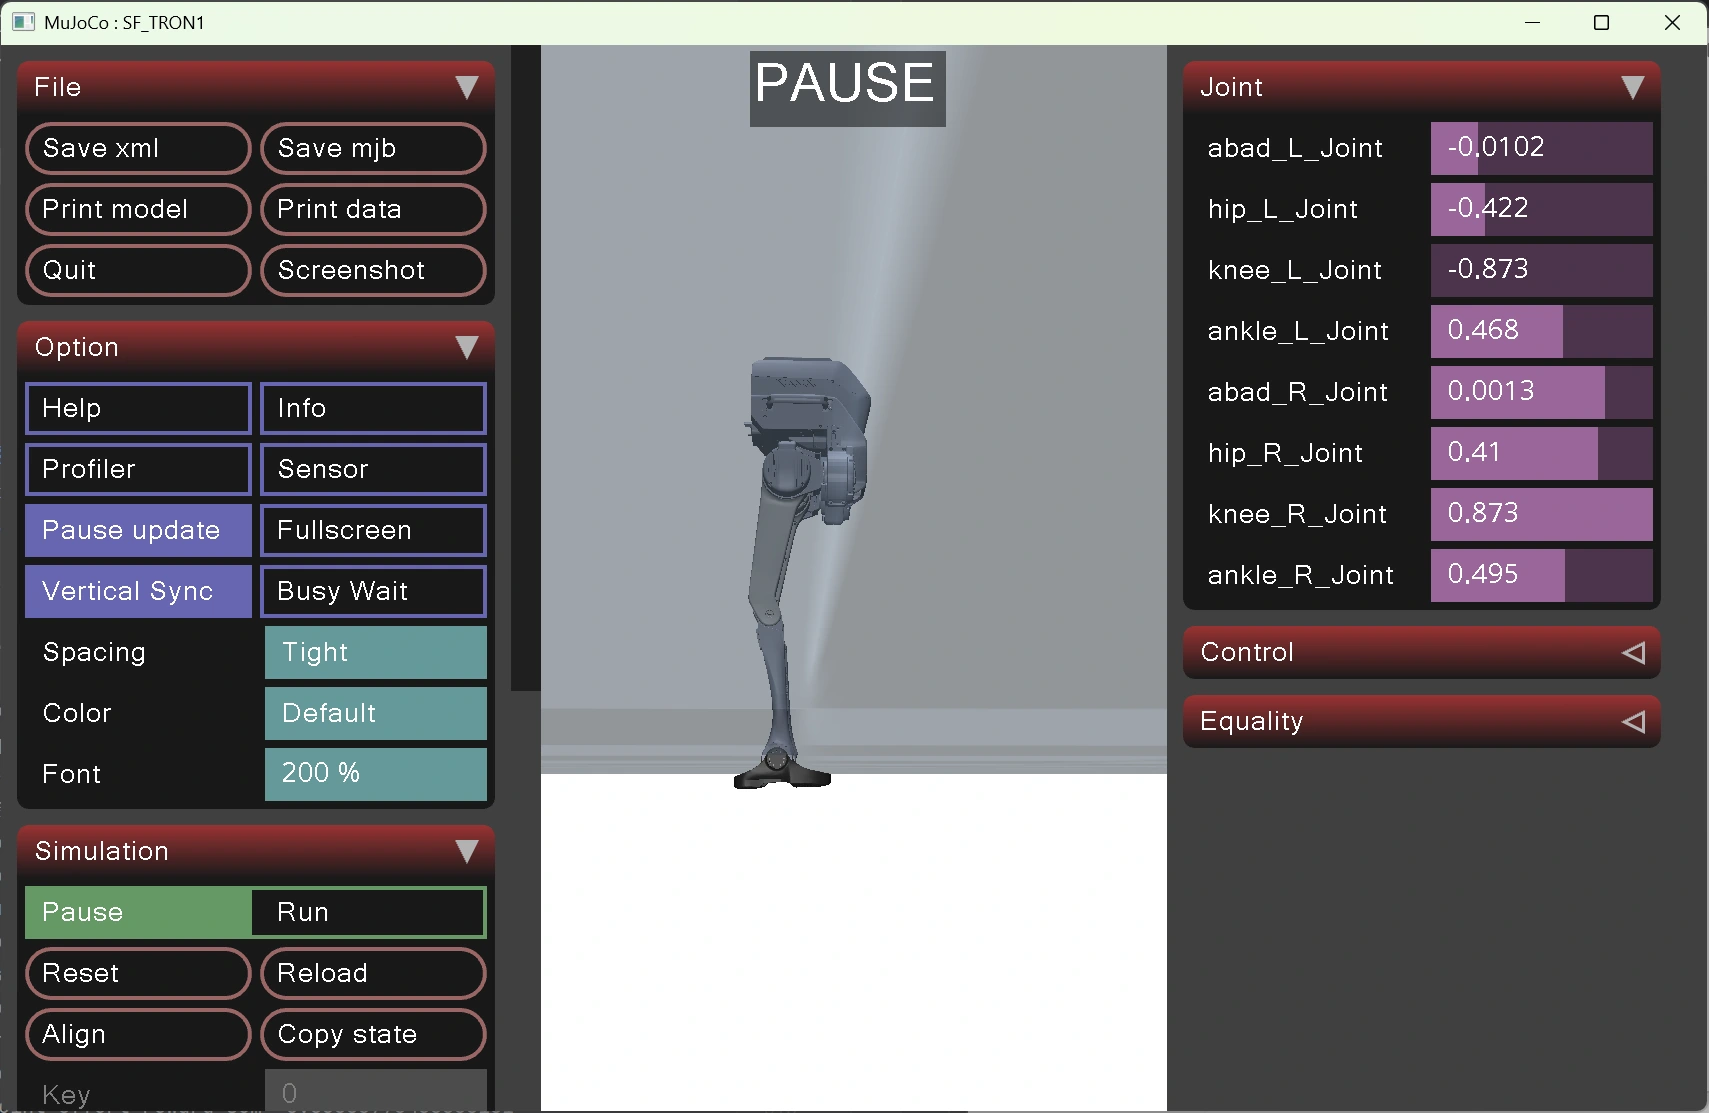
I participated in Isaac Gym–MuJoCo transfer and evaluation, comparing joint position, velocity, and torque to investigate differences in system response. Mechanical-power and CoT analysis provided additional ways to examine locomotion efficiency.
Motion
Position and velocity traces reveal changes in excursion, timing, and tracking under a matched command.
Actuation
Torque traces put similar-looking motion in context: PD response, saturation, and loading can differ.
Energy
Power and work must use the same interval and accounting convention before comparing transport cost.
06 / Reconstruct
Hardware Data & 3D Motion Replay
I processed physical-robot joint-angle and body-pose data and developed 3D motion replays. In MuJoCo–hardware comparisons, I used single-joint sinusoidal tests to diagnose and correct inconsistent simulation and execution time bases.
A measured-data replay helps inspect coordination and posture over time. It reconstructs a recorded motion; it does not by itself demonstrate a controller running on hardware or validate a simulator’s dynamics.
Simulation–Hardware Timing Diagnosis
I used single-joint sinusoidal tests to investigate timing differences between simulated and measured joint responses. The historical diagnostic record showed an effective approximately 2-ms execution interval despite nominal 1-ms simulation steps. I traced the discrepancy to inconsistent simulation and execution time bases and corrected the comparison timing.
The nominal step describes simulated time; the execution interval describes elapsed wall-clock time. Keeping these time bases distinct is necessary before interpreting a difference in joint-response timing.
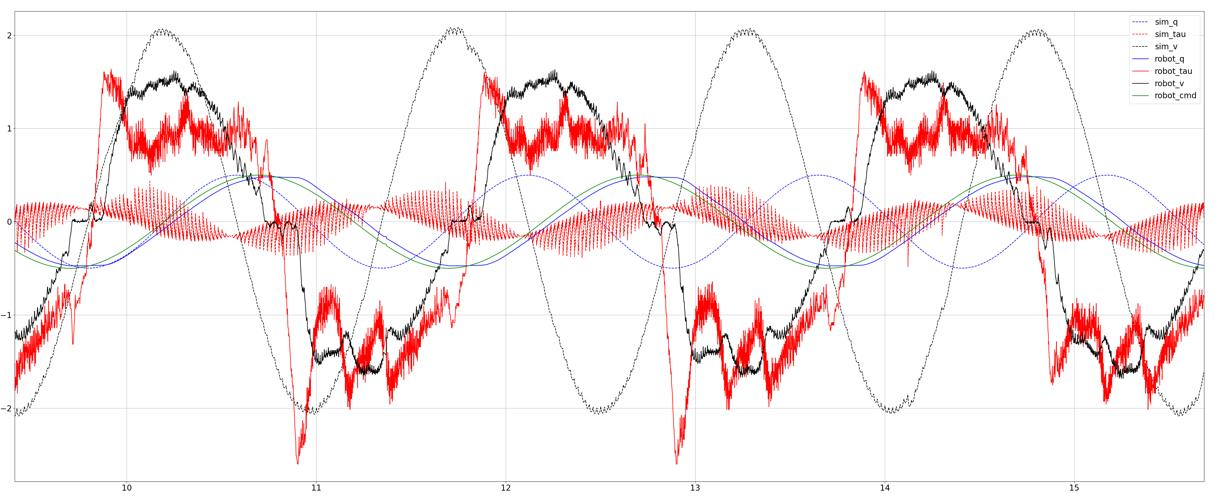
The timing finding is documented in the historical notes on pp. 7–8. A numerical before-and-after trajectory error has not been independently reconstructed from the retained logs.
- RecordJoint angles and body pose
- AlignTiming, joint order, and coordinate frames
- ReconstructRobot geometry and 3D motion
- CompareSelected simulation and measured signals
What This Work Taught Me
Locomotion analysis needs more than a reward curve or a convincing animation. Gait phase tells me when a joint acts; torque and velocity explain its mechanical role; energy accounting defines what an efficiency number means. Comparing models and measurements then reveals which parts of that explanation survive a change of platform.
About the evidence on this page
The contribution statements follow my October 2026 CV’s account of the July–December 2025 project. The human–TRON curves come from historical team notes supplied for this case study (Zuojun PDF, p. 31); the gait diagnostic observations draw on p. 33, and the single-joint timing test and time-base finding come from pp. 7–8. My responsibility for the timing diagnosis and correction was confirmed separately from the authorship of the team notes. The gait-phase diagram was newly drawn as a schematic. The 2D and 3D animations were re-rendered from retained simulation records; their generation and source-run details are recorded separately from the historical project period. Team plots are not attributed to me as sole author.
The curves preserve the original plotted data, while the animations reproduce saved simulation states. No new walking benchmark, hardware efficiency result, or numerical sim-to-sim agreement is claimed. The remaining reserved areas identify the records needed for joint-power analysis and a verified hardware replay.